Gantt Charts and Agile: charts, methodology and tools
- 原创
- 2018-02-14 15:13:59
- Renee
- 1643
A Gantt chart is a scheduling tool used in project management to show what has to be done and when. Since the first Gantt chart was created over a century ago, Gantt chart has been identified as "one of the most widely used management tools for project scheduling and control". 1 If you want to learn more about Gantt charts and its importance, please refer to The Importance of Gantt Charts.
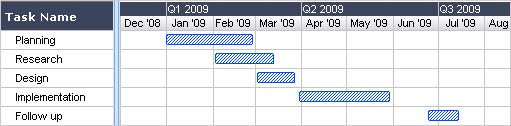
A Simple Gantt chart
What are Gantt charts?
Gantt charts are named after Henry Gantt, an American engineer and project management consultant, who devised his own version of the chart based on Karol Adamiecki who created the very first Gantt chart.
Let's look at an example from Wikipedia and see how a Gantt chart converts data into a diagram.
"There are seven tasks, labeled a through g. Some tasks can be done concurrently ( a and b) while others cannot be done until their predecessor task is complete ( c and d cannot begin until a is complete). Additionally, each task has three-time estimates: the optimistic time estimate ( O), the most likely or normal time estimate ( M), and the pessimistic time estimate ( P). The expected time ( T E) is estimated using the beta probability distribution for the time estimates, using the formula ( O + 4 M + P) ÷ 6."
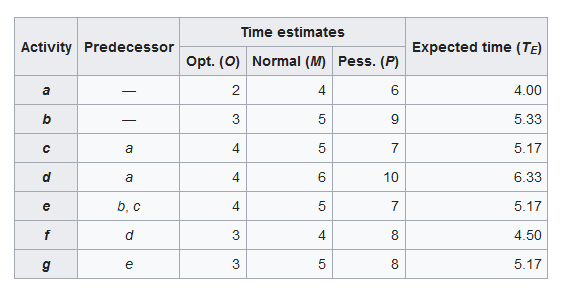
The diagram below is a Gantt chart with all information provided in the table above.

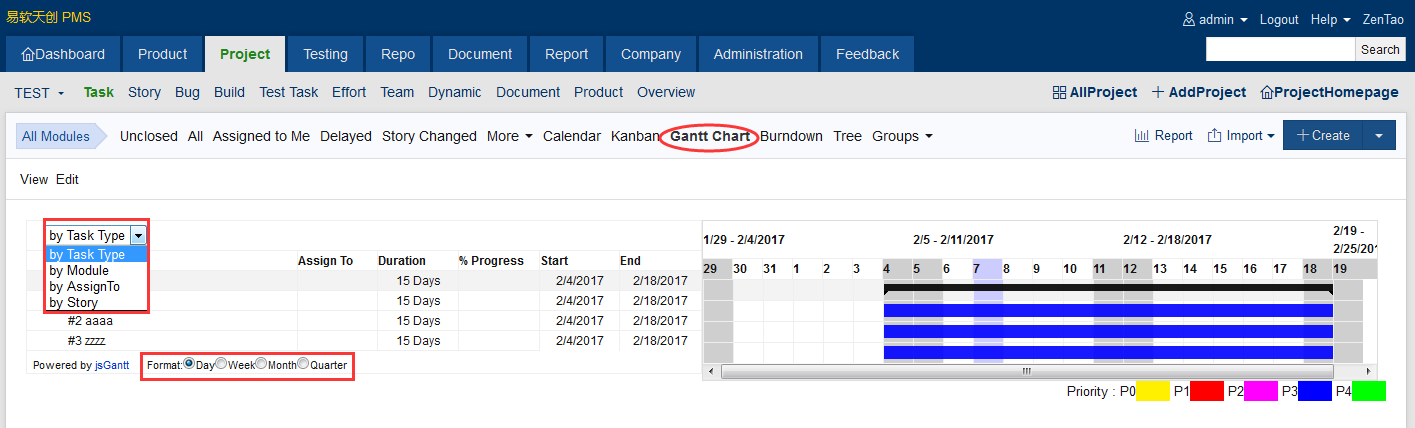
What is a Gantt chart in Agile?
Reference
1. Klein, R. (1999). Scheduling of Resource-Constrained Projects. Operations Research/Computer Science Interfaces Series. Springer US. ISBN 978-0-7923-8637-7.
2. https://en.wikipedia.org/wiki/Gantt_chart
3. http://www.gantt.com/